pySPWB icon

Measurement signal processing, free and on any machine.

Spectra, transfer functions, coherence, spectrograms and adaptive filtering — in a desktop application you can simply download and run, and in a Python library you can call from a notebook. The same maths in both.

Version 1.1.1 · Windows, macOS and Linux · runs with or without Python installed · MIT licensed, no account, no telemetry
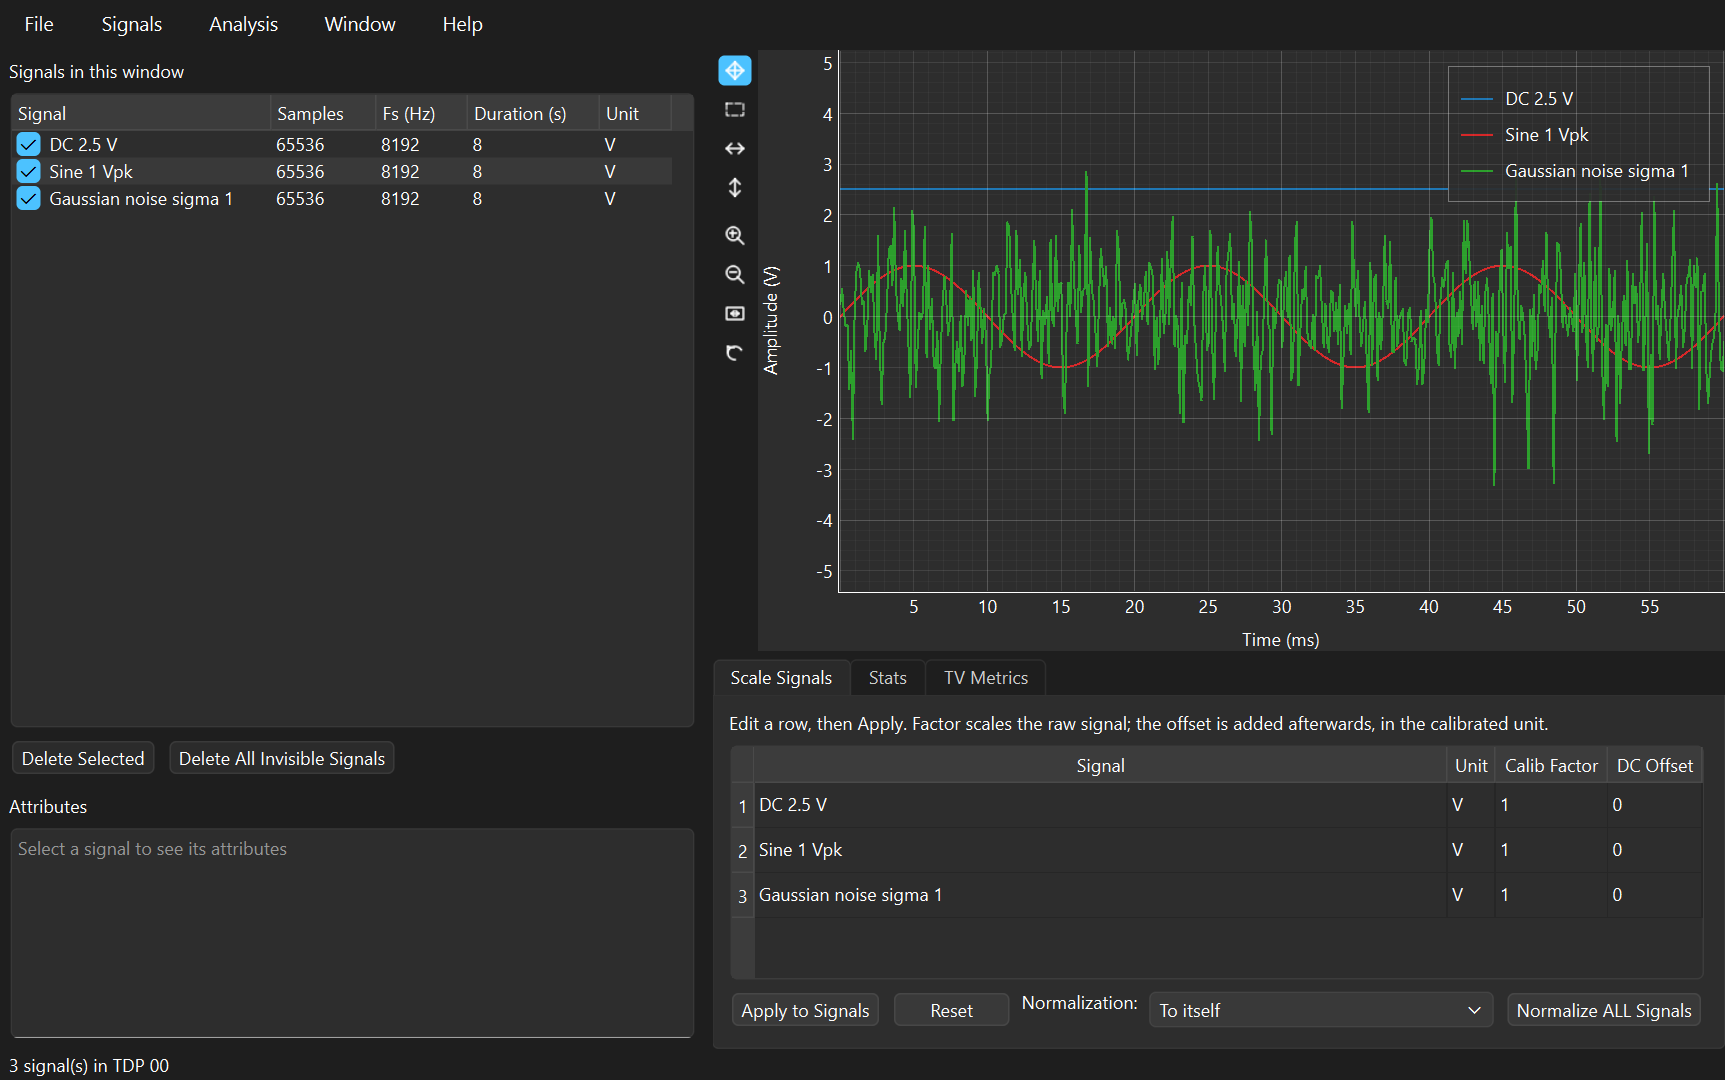
The pySPWB Time Data Processing window showing several measured signals plotted together

Who this is for

Anyone who has a recorded signal and a question about it — and who would rather not spend a five-figure licence, or an afternoon of setup, before getting an answer.

Vibration and acoustics engineers

The frequency response of a structure, coherence between a hammer and an accelerometer, sound pressure level in dB against 20 µPa, a run-up caught in a spectrogram. The everyday work, without a per-seat licence.

Students learning DSP

Windowing, leakage, averaging and estimator choice stop being formulas when you can watch a flat-top window fix an amplitude a Hanning window got wrong. Free, and it runs on the laptop you already own.

Teachers and lab courses

Nothing to install and no licence server: hand out a folder, or a one-line pip command. Every analysis window has a manual that works through demonstration data the application generates itself.

Consultants and small companies

The measurement work is the same whether or not there is a LabVIEW licence behind it. This removes that line from the quote entirely — and the results match what the licensed tool produced.

Researchers who script

The whole processing layer is an importable library with no GUI attached. Work it out once by hand in the application, then run it over four hundred files from a notebook.

Existing SPWB users

The LabVIEW SPWB reached end of life. This is where it went: the same multi-window signal sharing, the same numbers, now on macOS and Linux too.

Five analysis windows, and they talk to each other

Send the same signals to an FFT, a transfer function and a spectrogram at once, and they stay in step — the multi-window signal sharing SPWB has always been known for.

Time Data Processing

Start with the signal itself

Load a measurement, look at it, and condition it: scale and calibrate, offset, resample, truncate, normalise. Statistics and time-varying metrics — RMS, crest factor, kurtosis, trends — sit beside the plot rather than in another tool.

It reads HDF5, TDMS, WAV and CSV, plus RPC-III, Nastran punch and HEAD acoustics files.

Time Data Processing window with several signals plotted and a statistics table
FFT Analysis

Spectra you can quote

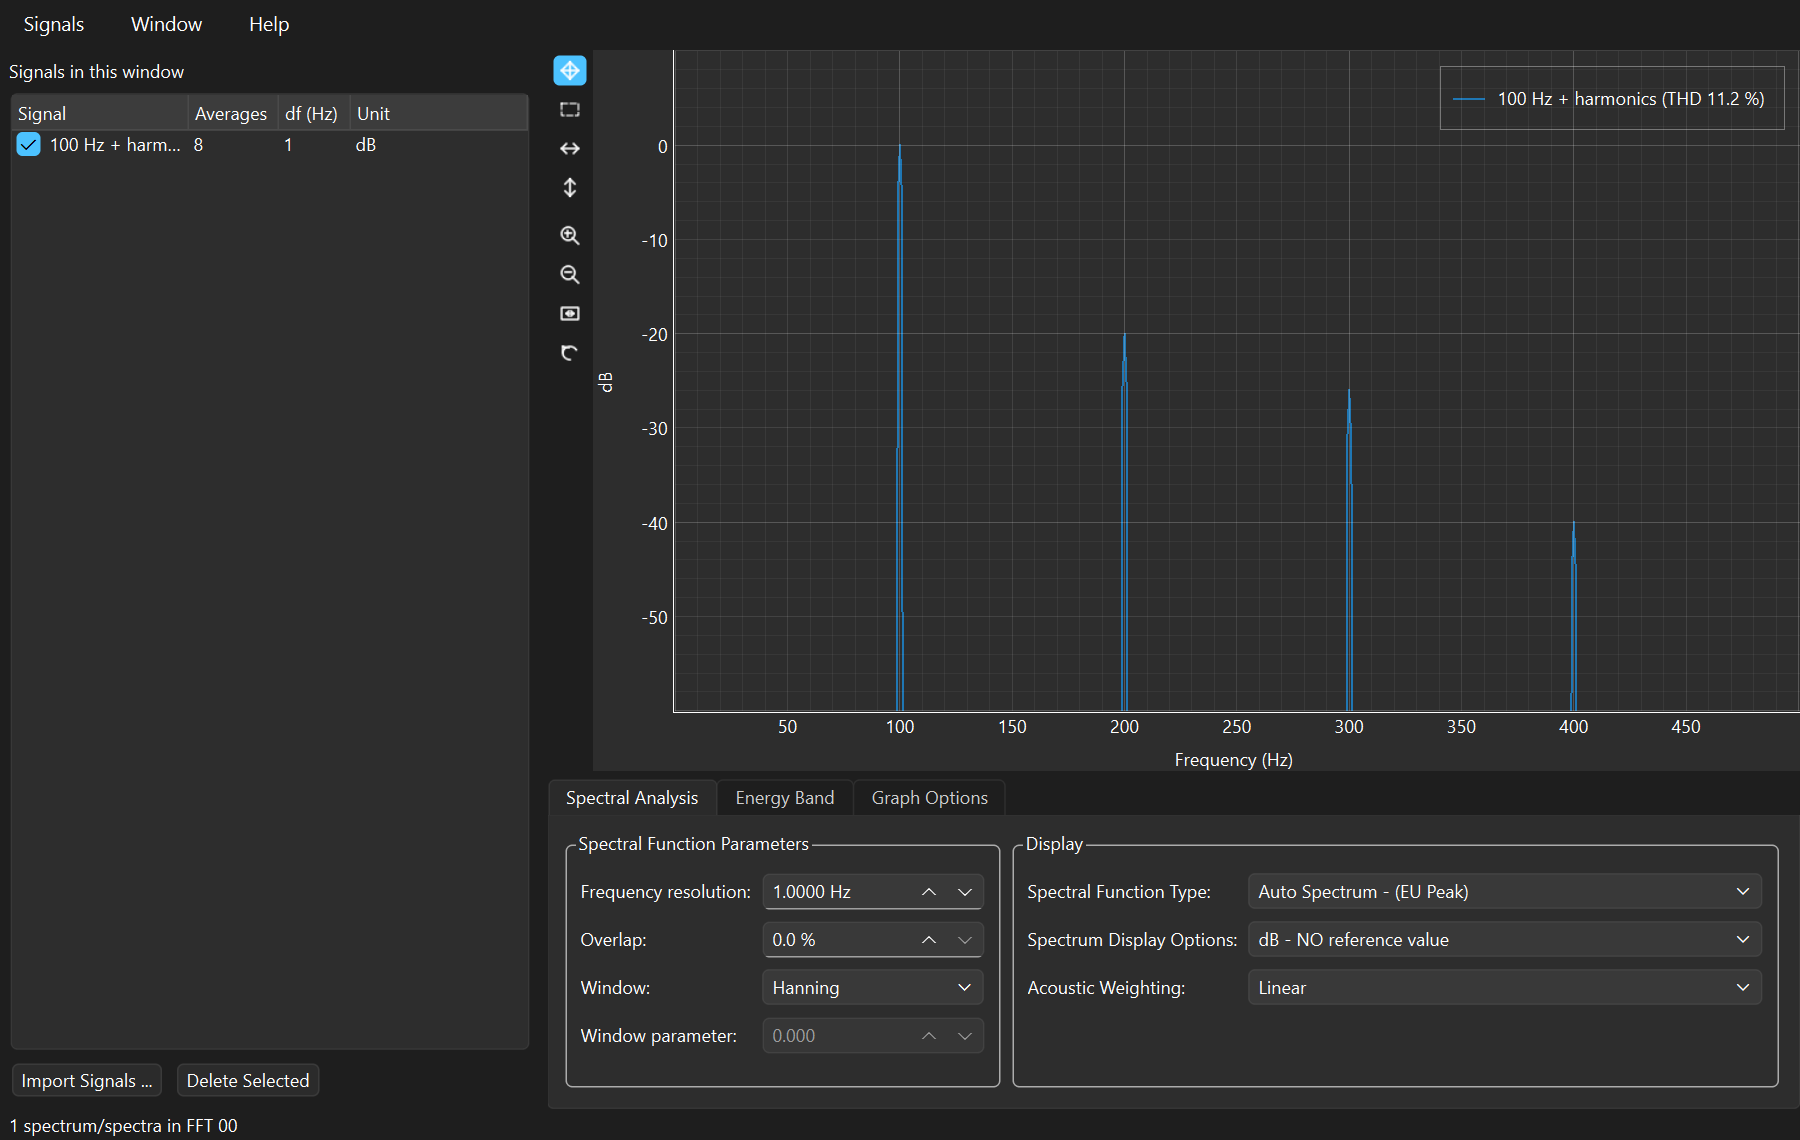
Averaged auto power spectra with the window, overlap and frequency resolution you choose. A-weighting and dB references for acoustics, band RMS and energy over a cursor range, harmonic markers.

A 1 V sine reads 1 V and a 94 dB calibrator reads 94 dB — the amplitude scaling follows the instrument convention, not whatever the FFT happened to return.

FFT Analysis window showing a spectrum with harmonic markers
Transfer Function

Frequency response, with the coherence to judge it

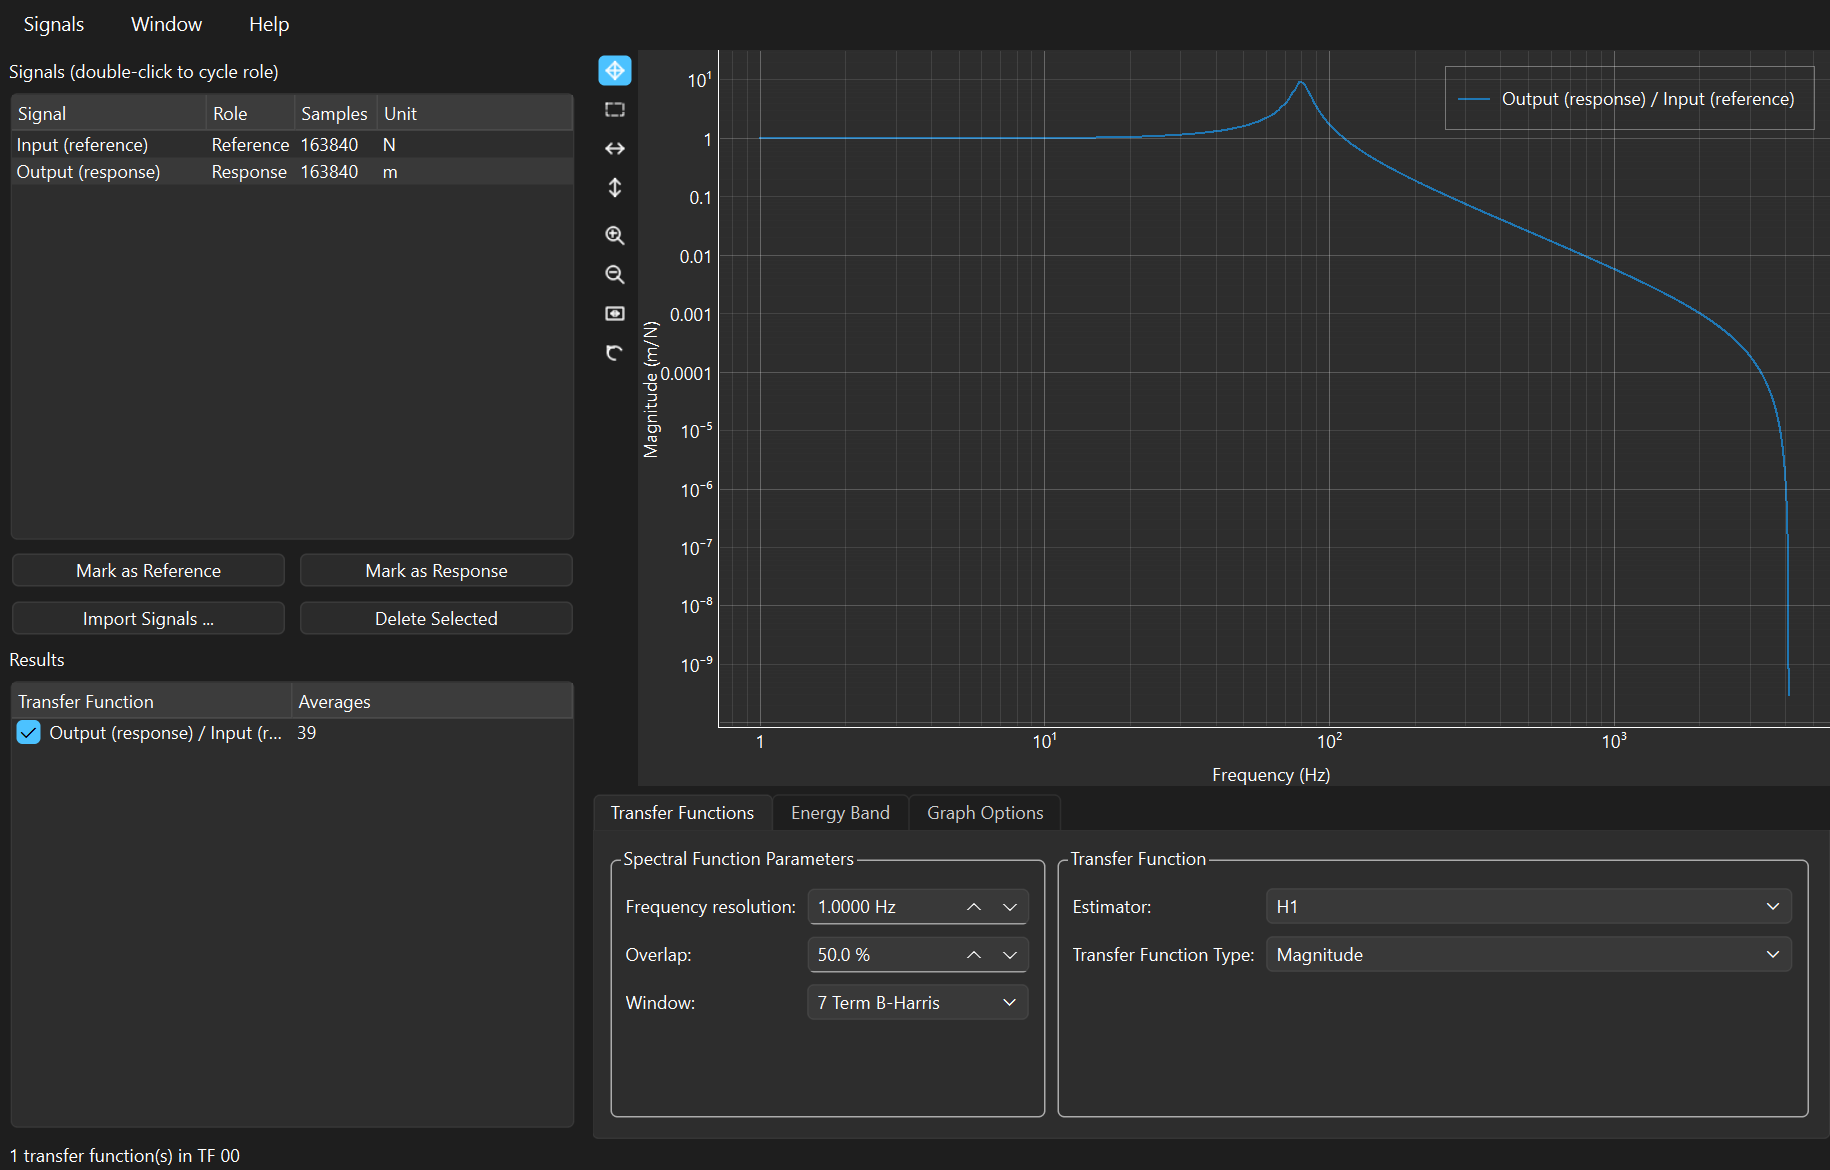
H1 and H2 estimators; magnitude, phase, real and imaginary, Nyquist. Coherence is plotted alongside, so you can see which parts of the response the measurement actually supports and which are noise dressed up as a resonance.

Transfer Function window showing magnitude, phase and coherence
Time-Frequency

Watch the spectrum change

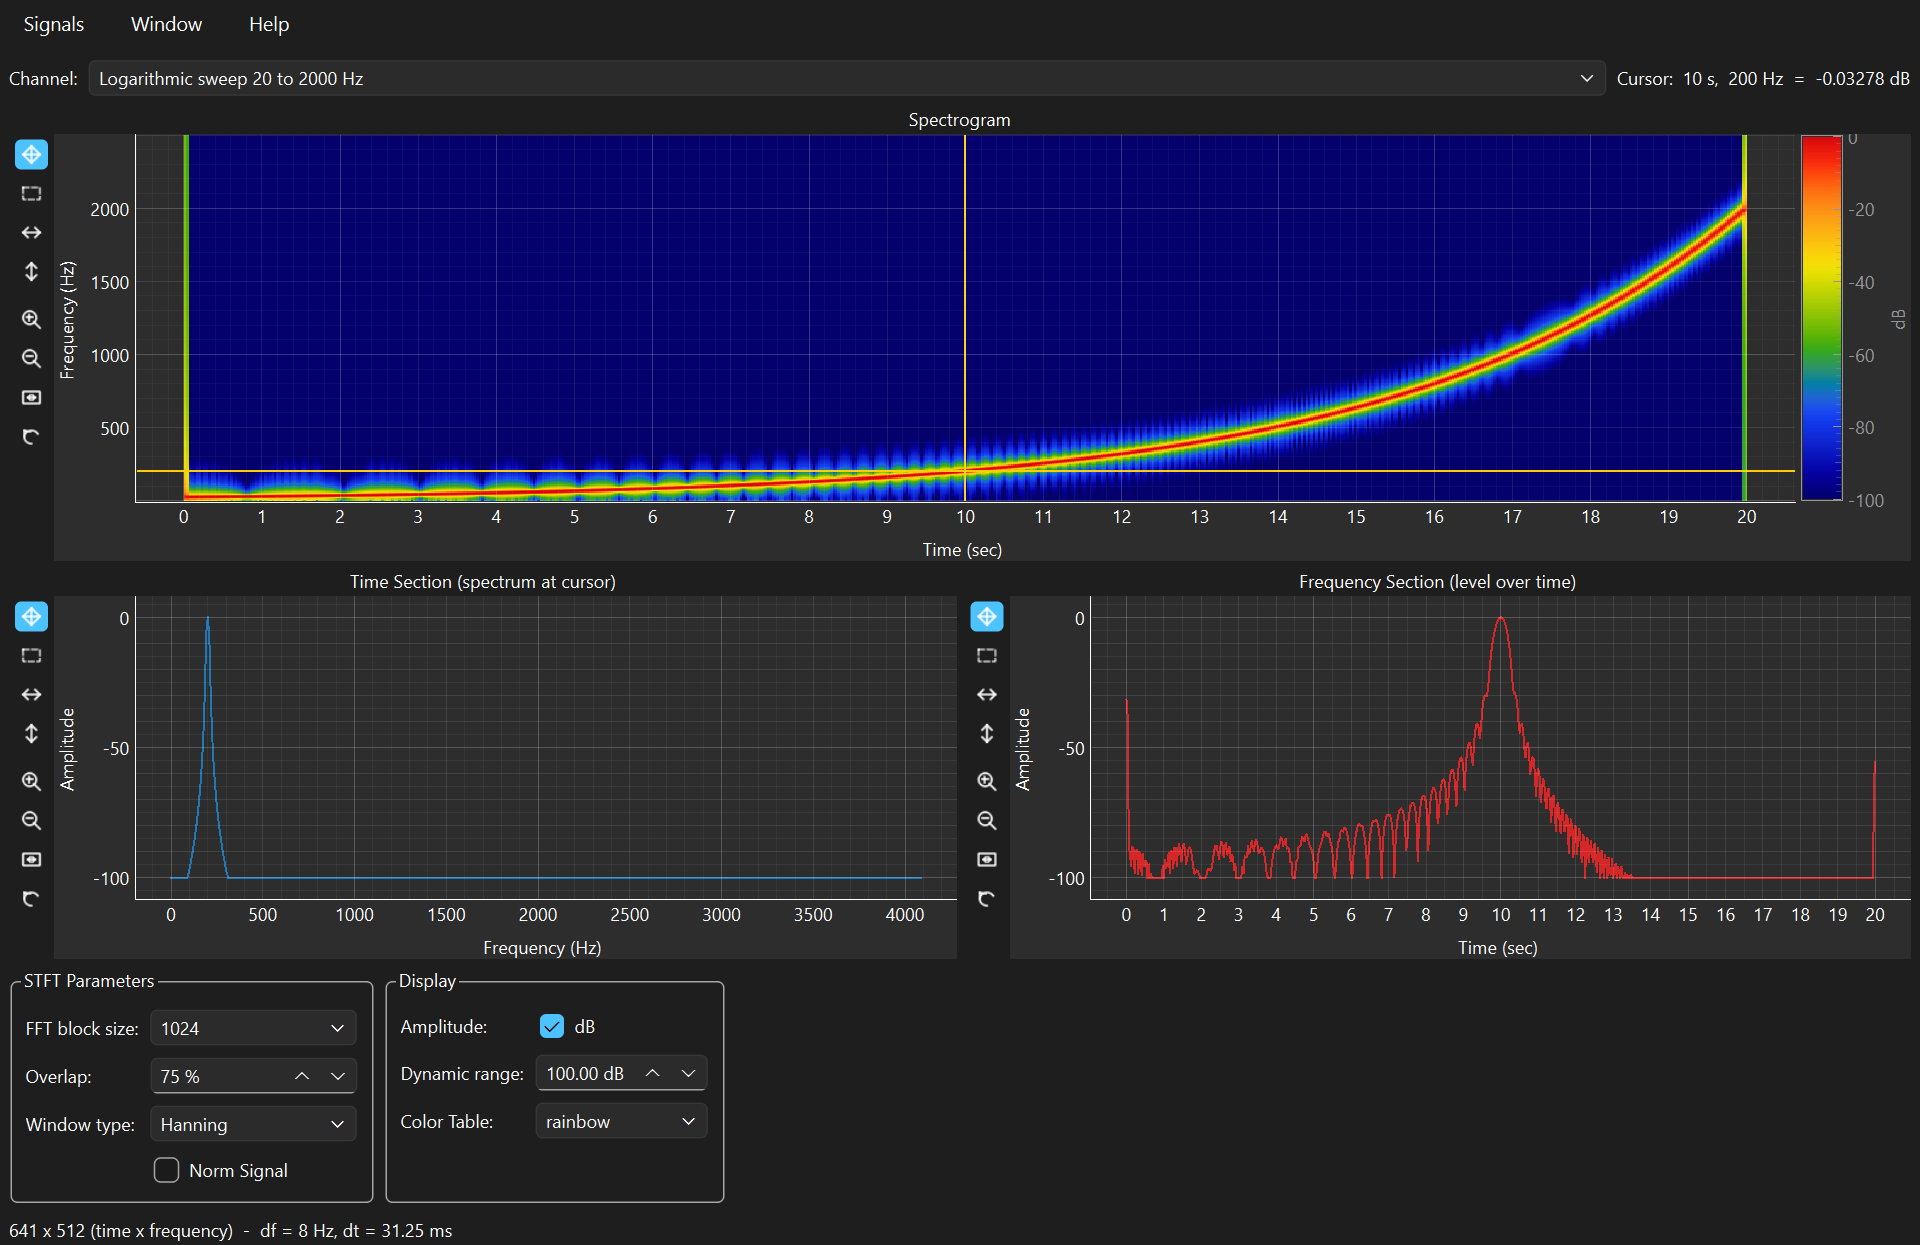
A colour spectrogram for anything that will not hold still: run-ups, sweeps, impacts, speech, transient events. Cursors cut a slice in time or in frequency, and the slice plots as an ordinary spectrum.

Time-Frequency window showing a logarithmic sweep as a colour spectrogram
Adaptive Filtering

Remove what a reference can explain

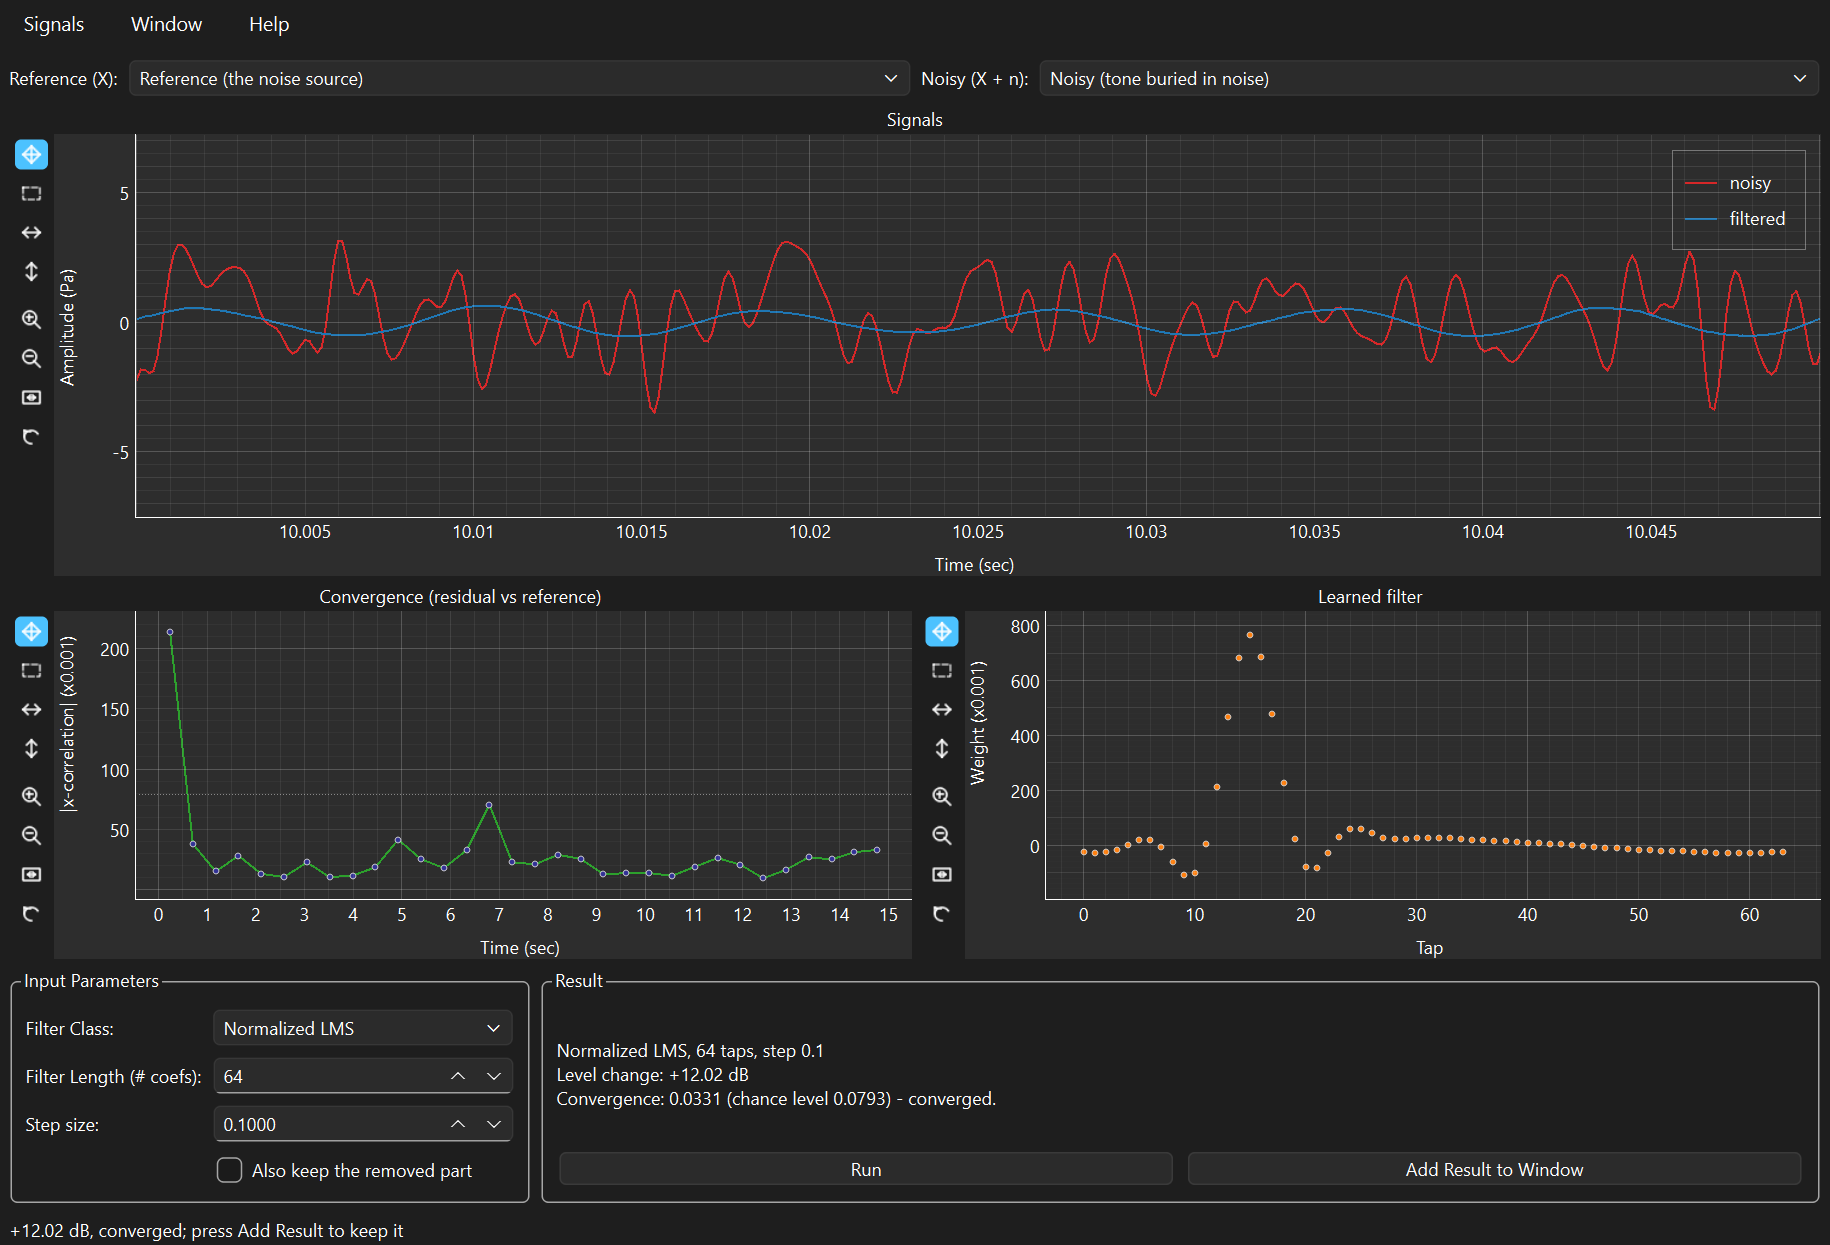
Give it the contaminated signal and a reference correlated with the contamination, and the LMS family — plain, normalised, and two noise-cancelling variants — adapts a filter that subtracts it. Convergence is plotted, so you can see whether it worked rather than hope.

Adaptive Filtering window showing a cleaned signal and a convergence curve

Two ways to run it. Neither needs the other.

The application and the library are the same code, and you can take whichever half suits you.

Download and run — no Python at all

The program, the Python it runs on and every library it needs, in one folder. There is no prerequisite of any kind: no Python to install, no packages, no administrator rights, no installer.

  • Windows: an installer, or a portable zip that registers nothing
  • macOS: unzip and open, on Apple Silicon and Intel
  • No administrator rights, on either
  • Nothing written outside the application's folder except your own settings

Install with pip

For notebooks, for scripting, for Linux — and for anyone who would rather have the library than an application.

pip install spwb # the library: numpy + scipy
pip install spwb[gui] # the full application
spwb # then run it
  • One wheel for Windows, macOS and Linux
  • Python 3.10 or newer
  • The library imports with no Qt anywhere near it

Supported platforms

Download and run pip install
Windows (64-bit) Yes — SPWB-windows-x64.zip Yes
macOS (Apple Silicon) Yes — SPWB-macos-apple-silicon.zip Yes
macOS (Intel) Yes — SPWB-macos-intel.zip Yes
Linux Not published — a bundle is tied to the glibc that built it Yes, and it is the better route

The numbers are not approximations

A signal processing tool is only worth having if you can quote what it prints.

pySPWB began as the Python port of the LabVIEW Signal Processing Work Bench, and its results are not a re-interpretation of the maths. They are pinned to reference data generated by driving LabVIEW 2022 itself, and that comparison runs automatically on every change — so a spectrum, transfer function or spectrogram you obtained with the original software still comes out the same here.

The application saves to plain HDF5, an open standard that MATLAB, Julia, R and HDFView read without pySPWB installed, so your measurements never become hostage to the tool that recorded them. And every downloadable build is checked on its own platform before it is published: it has to open all five analysis windows, write and re-read an HDF5 file, and return the right numbers for a spectrum and a transfer function, or it is never released.

Documentation

A manual for every analysis window, each working through demonstration data the application creates for you from its own File menu — with a companion notebook that computes the same numbers in a few lines of Python.

Companion notebooks

The same analyses in Python, ready to run and adapt.

Source code

All of it, MIT licensed.

The original

The LabVIEW software this grew out of, also open source.

Download pySPWB 1.1.1

Free. No account, no ads, no telemetry, and nothing to install alongside it.

Windows

Installer

SPWBSetup-1.1.1.exe, about 62 MB. Run it: SPWB lands in the Start menu, with a desktop shortcut if you want one, and can be removed again from Add or Remove Programs. Installs for you alone, so it never asks for an administrator.

Download for Windows

Or take SPWB-windows-x64.zip (95 MB) for a portable copy that registers nothing — unzip it and run SPWB.exe.

macOS

Apple Silicon

SPWB-macos-apple-silicon.zip, about 61 MB. Unzip and open SPWB.app.

Download for Apple Silicon
macOS

Intel

SPWB-macos-intel.zip, about 68 MB. Unzip and open SPWB.app.

Download for Intel Mac

All three links open the same GitHub release page — scroll to Assets and pick the file for your system. With a zip, keep the unzipped folder together: the program needs the files beside it. On Linux, or in a notebook, use pip install spwb[gui] instead.

The downloads are not code-signed. Windows will show a SmartScreen warning the first time — choose More info, then Run anyway. macOS wants you to right-click the app and choose Open once, or run xattr -cr /path/to/SPWB.app. Signing certificates cost money every year; instead every release carries a SPWB-checksums.txt, so you can verify exactly what you downloaded.